MarkerMarkerMarker
2
MarkerMarkerMarkerMarkerMarkerMarkerMarkerMarker
2
MarkerMarkerMarkerMarkerMarkerMarkerMarker
2
Leaflet © OpenStreetMap contributors | © CARTO
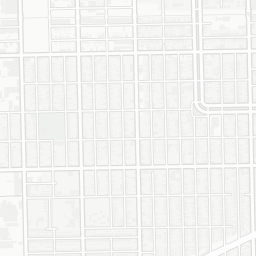
El stop
CPS school
Public library
Chicago Fire Department station
Chicago Police Department station
Chicago Park District park
Federally qualified health center

Tips

  • Click on a marker to see more information about that resource.
  • Click on a green cluster to view all resources in that area.
Hover over any bar, dot or line to see the full indicator name and any exact values.
Biggest Shifts

These demographic and thematic indicators have changed the most in West Garfield Park over all years of coverage. Use this chart to understand trends in neighborhood composition and context.

Indicators
Chart
Chart with 3 data series. Columnrange charts are column charts displaying a range between a lower and higher value for each point.
The chart has 1 X axis displaying categories.
The chart has 1 Y axis displaying Change (%). Data ranges from -23.405999191438017 to 17.328154485000006.
Unique Trends

These demographic and thematic indicators have changed the most in West Garfield Park relative to change for Chicago as a whole over all years of coverage. Use this chart to understand where neighborhood trends diverge from citywide trends.

Indicators
Chart
Chart with 4 data series.
The chart has 1 X axis displaying categories.
The chart has 1 Y axis displaying Change (%). Data ranges from -23.405999191438017 to 17.328154485000006.

Demographics

Hover over any bar, dot or line to see the full indicator name and any exact values.

Race/Ethnicity

Population by Race/Ethnicity Snapshot: 2023

Percent of residents by racial group and Hispanic or Latino origin

Chart
Bar chart with 2 data series.
The chart has 1 X axis displaying categories.
The chart has 1 Y axis displaying %. Data ranges from 0.032795991207128845 to 91.66173858652311.
American Community Survey, 5-Year Estimates

Population by Race/Ethnicity Over Time: 2013-2023

Percent of residents by racial group and Hispanic or Latino origin

Chart
Chart with 8 data series.
The chart has 1 X axis displaying categories.
The chart has 1 Y axis displaying %. Data ranges from 0 to 100.
American Community Survey, 5-Year Estimates

Age

Population by Age Snapshot: 2023

Percent of residents grouped by age brackets

Chart
Bar chart with 2 data series.
The chart has 1 X axis displaying categories.
The chart has 1 Y axis displaying %. Data ranges from 5.14915087464984 to 57.09674965135794.
American Community Survey, 5-Year Estimates

Population by Age Over Time: 2013-2023

Percent of residents grouped by age brackets

Chart
Chart with 5 data series.
The chart has 1 X axis displaying categories.
The chart has 1 Y axis displaying %. Data ranges from 8.9945364255513 to 100.
American Community Survey, 5-Year Estimates

Health & Safety

Hover over any bar, dot or line to see the full indicator name and any exact values.

Poverty

Population Below Poverty Line: 2013-2023

Chart
Line chart with 11 data points.
The chart has 1 X axis displaying categories.
The chart has 1 Y axis displaying values. Data ranges from 31.564960473311523 to 48.10533762801085.
20132023
Value: 47.32% 15.71%31.61%
Rank: 10th of 77 18 spots28th of 77

Children Below Poverty Line: 2013-2023

Chart
Line chart with 11 data points.
The chart has 1 X axis displaying categories.
The chart has 1 Y axis displaying values. Data ranges from 40.446865208059094 to 61.05770387807452.
20132023
Value: 60.89% 15.18%45.71%
Rank: 8th of 77 9 spots17th of 77

Health Outcomes

Life Expectancy: 2010-2022

Chart
Line chart with 13 data points.
The chart has 1 X axis displaying categories.
The chart has 1 Y axis displaying values. Data ranges from 63.39939329 to 71.87367186.
20102022
Value: 69 years 5 years63 years
Rank: 76th of 77 1 spots77th of 77

Teen Birth Rate: 2009-2022

Chart
Line chart with 10 data points.
The chart has 1 X axis displaying categories.
The chart has 1 Y axis displaying values. Data ranges from 30.360314 to 88.975297.
20092022
Value: 87 births/1k teens 57 births/1k30 births/1k teens
Rank: 3rd of 77 26 spots29th of 77

Infant Mortality Rate: 2004-2022

Chart
Line chart with 11 data points.
The chart has 1 X axis displaying categories.
The chart has 1 Y axis displaying values. Data ranges from 5.6 to 19.
20042022
Value: 15 deaths/1k births 0 deaths/1k15 deaths/1k births
Rank: 55th of 77 5 spots60th of 77

Low Birthweight Rate: 2004-2022

Chart
Line chart with 11 data points.
The chart has 1 X axis displaying categories.
The chart has 1 Y axis displaying values. Data ranges from 15.1 to 17.179487.
20042022
Value: 16.2% 0.11%16.31%
Rank: 49th of 77 2 spots51st of 77

Healthcare Access

Primary Care Provider Rate: 2016-2023

Chart
Line chart with 6 data points.
The chart has 1 X axis displaying categories.
The chart has 1 Y axis displaying values. Data ranges from 53.4 to 81.686048917.
20162023
Value: 53.4% 17.33%70.73%
Rank: 75th of 77 3 spots72nd of 77

Population Under 18 with Health Insurance: 2013-2023

Chart
Line chart with 11 data points.
The chart has 1 X axis displaying categories.
The chart has 1 Y axis displaying values. Data ranges from 93.02710789208061 to 99.52055030392664.
20132023
Value: 93.03% 6.41%99.43%
Rank: 63rd of 77 58 spots5th of 77

Population Ages 18-64 With Health Insurance: 2013-2023

Chart
Line chart with 11 data points.
The chart has 1 X axis displaying categories.
The chart has 1 Y axis displaying values. Data ranges from 64.51981179083941 to 85.42902204135581.
20132023
Value: 64.69% 20.08%84.78%
Rank: 59th of 77 10 spots49th of 77

Population 65+ With Health Insurance: 2013-2023

Chart
Line chart with 11 data points.
The chart has 1 X axis displaying categories.
The chart has 1 Y axis displaying values. Data ranges from 98.51088725472404 to 99.998786724513.
20132023
Value: 99.39% 0.33%99.06%
Rank: 17th of 77 14 spots31st of 77

Public Safety

Homicide Rate: 2010-2023

Chart
Line chart with 14 data points.
The chart has 1 X axis displaying categories.
The chart has 1 Y axis displaying values. Data ranges from 0.0753694496095474 to 0.21401466585374873.
20102023
Value: 0.078 cases per capita 0.089 cases0.167 cases per capita
Rank: 1st of 77 No change1st of 77

Violent Crime Rate: 2010-2023

Chart
Line chart with 14 data points.
The chart has 1 X axis displaying categories.
The chart has 1 Y axis displaying values. Data ranges from 3.265388578427463 to 4.8358003679702755.
20102023
Value: 4.045 crimes per capita 0.054 crimes3.991 crimes per capita
Rank: 3rd of 77 1 spots2nd of 77

Economic Vitality

Hover over any bar, dot or line to see the full indicator name and any exact values.

Households

Population by Household Income: 2013-2023

Chart
Chart with 5 data series.
The chart has 1 X axis displaying categories.
The chart has 1 Y axis displaying values. Data ranges from 1.9956607985057 to 100.
End of interactive chart.
 Less than $25k 9.2% $25-50k 3.09% $50-75k 1.69% $75-125k 6.01% More than $125k 5.87%

Household Type: 2013-2023

Chart
Chart with 4 data series.
The chart has 1 X axis displaying categories.
The chart has 1 Y axis displaying values. Data ranges from 3.8041869535307 to 100.
End of interactive chart.
 Married-Couple Family Households 1.53% Other Family Households 13.42% Non-Family Household, Living Alone 14.7% Non-Family Household, Not Living Alone 0.05%

Household Size: 2013-2023

Chart
Chart with 7 data series.
The chart has 1 X axis displaying categories.
The chart has 1 Y axis displaying values. Data ranges from 5.2375444431266 to 100.
End of interactive chart.
 1 Person 14.7% 2 People 1.53% 3 People 1.77% 4 People 3.63% 5 People 1.08% 6 People 0.82% 7 Or More People 1.21%

Unemployment

Unemployment Rate: 2013-2023

Chart
Line chart with 11 data points.
The chart has 1 X axis displaying categories.
The chart has 1 Y axis displaying values. Data ranges from 8.043435274105692 to 12.759899258870927.
End of interactive chart.
20132023
Value: 12.46% 0.24%12.22%
Rank: 65th of 77 5 spots70th of 77

Unemployment Rate Ages 16-19: 2013-2023

Chart
Line chart with 11 data points.
The chart has 1 X axis displaying categories.
The chart has 1 Y axis displaying values. Data ranges from 8.05767575153971 to 48.06624570330515.
End of interactive chart.
20132023
Value: 13.49% 34.58%48.07%
Rank: 70th of 77 48 spots22nd of 77

Unemployment Rate Ages 20-24: 2013-2023

Chart
Line chart with 11 data points.
The chart has 1 X axis displaying categories.
The chart has 1 Y axis displaying values. Data ranges from 13.849998475725158 to 42.820481118371895.
End of interactive chart.
20132023
Value: 18.81% 24.01%42.82%
Rank: 44th of 77 20 spots24th of 77

Employment & Workforce

Commute Time: 2013-2023

Chart
Chart with 4 data series.
The chart has 1 X axis displaying categories.
The chart has 1 Y axis displaying values. Data ranges from 15.227742831772 to 100.
End of interactive chart.
 Less than 15 min 6.09% 15-29 min 8.58% 30-59 min 7.06% An hour or more 9.54%

Academic Completion: 2013-2023

Chart
Chart with 6 data series.
The chart has 1 X axis displaying categories.
The chart has 1 Y axis displaying values. Data ranges from 0.86701448407155 to 100.
End of interactive chart.
 No HS Diploma 2.22% HS Diploma or GED 6.79% Some College 5.61% Associate's 0.6% Bachelor's 2.18% Above Bachelor's 1.53%

Resources

SNAP Enrollment Rate: 2013-2023

Chart
Line chart with 11 data points.
The chart has 1 X axis displaying categories.
The chart has 1 Y axis displaying values. Data ranges from 48.32924398318955 to 54.03628694123024.
End of interactive chart.
20132023
Value: 48.95% 1.36%50.31%
Rank: 13th of 77 1 spots14th of 77

Public Assistance Enrollment Rate: 2013-2023

Chart
Line chart with 11 data points.
The chart has 1 X axis displaying categories.
The chart has 1 Y axis displaying values. Data ranges from 4.267662098994129 to 11.289868681984125.
End of interactive chart.
20132023
Value: 11.29% 6.61%4.68%
Rank: 74th of 77 47 spots27th of 77

Supplemental Security Income Enrollment Rate: 2013-2023

Chart
Line chart with 11 data points.
The chart has 1 X axis displaying categories.
The chart has 1 Y axis displaying values. Data ranges from 17.20667706400527 to 21.5176550910003.
End of interactive chart.
20132023
Value: 21.07% 2.23%18.84%
Rank: 49th of 77 9 spots58th of 77

Households Without Internet Access: 2017-2023

Chart
Line chart with 7 data points.
The chart has 1 X axis displaying categories.
The chart has 1 Y axis displaying values. Data ranges from 17.241637819129412 to 40.64763701056743.
End of interactive chart.
20172023
Value: 40.65% 23.41%17.24%
Rank: 12th of 77 35 spots47th of 77

Households Without a Computer: 2017-2023

Chart
Line chart with 7 data points.
The chart has 1 X axis displaying categories.
The chart has 1 Y axis displaying values. Data ranges from 13.520471055762211 to 32.389197210191334.
End of interactive chart.
20172023
Value: 32.39% 18.87%13.52%
Rank: 17th of 77 51 spots68th of 77

Small Business

Small Business Loan Activity, Originations: 2020-2023

Chart
Line chart with 4 data points.
The chart has 1 X axis displaying categories.
The chart has 1 Y axis displaying values. Data ranges from 362.64722288623636 to 811.2463265978944.
End of interactive chart.
20202023
Value: 446 loans 83 loans363 loans
Rank: 35th of 77 10 spots45th of 77

Housing

Housing Tenure: 2013-2023

Chart
Chart with 2 data series.
The chart has 1 X axis displaying categories.
The chart has 1 Y axis displaying values. Data ranges from 72.023251615055 to 100.
End of interactive chart.
 Owner-occupied 0.69% Renter-occupied 0.69%

Foreclosure Filing Acitvity - All Residential Properties: 2005-2024

Chart
Line chart with 20 data points.
The chart has 1 X axis displaying categories.
The chart has 1 Y axis displaying values. Data ranges from 13 to 262.
End of interactive chart.
20052024
Value: 119 Count 86 Count33 Count
Rank: 74th of 77 32 spots42nd of 77

Foreclosure Auctions - All Residential Properties: 2005-2024

Chart
Line chart with 20 data points.
The chart has 1 X axis displaying categories.
The chart has 1 Y axis displaying values. Data ranges from 7 to 160.
End of interactive chart.
20052024
Value: 28 Count 21 Count7 Count
Rank: 39th of 77 25 spots14th of 77

Vacancy Rate: 2013-2023

Chart
Line chart with 11 data points.
The chart has 1 X axis displaying categories.
The chart has 1 Y axis displaying values. Data ranges from 21.72456554613083 to 30.53487943217118.
End of interactive chart.
20132023
Value: 30.53% 7.57%22.97%
Rank: 33rd of 77 21 spots54th of 77

Mortgage Burdened Rate: 2013-2023

Chart
Line chart with 11 data points.
The chart has 1 X axis displaying categories.
The chart has 1 Y axis displaying values. Data ranges from 42.63804285922193 to 55.09179980940673.
End of interactive chart.
20132023
Value: 55.09% 4.42%50.68%
Rank: 24th of 77 18 spots6th of 77

Own House Outright and Burdened by Costs: 2014-2023

Chart
Line chart with 10 data points.
The chart has 1 X axis displaying categories.
The chart has 1 Y axis displaying values. Data ranges from 25.089547452507837 to 41.4693265636548.
End of interactive chart.
20142023
Value: 34.09% 7.38%41.47%
Rank: 9th of 77 4 spots5th of 77

Rent Burdened Rate: 2013-2023

Chart
Line chart with 11 data points.
The chart has 1 X axis displaying categories.
The chart has 1 Y axis displaying values. Data ranges from 59.94597382241141 to 65.23139079088976.
End of interactive chart.
20132023
Value: 61.62% 1.07%60.55%
Rank: 9th of 77 5 spots4th of 77

Education

Hover over any bar, dot or line to see the full indicator name and any exact values.

Early Childhood

Population Under 5: 2013-2023

Chart
Line chart with 11 data points.
The chart has 1 X axis displaying categories.
The chart has 1 Y axis displaying values. Data ranges from 741.2570756784692 to 1870.5694030459024.
20132023
Value: 1644 children 903 children741 children
Rank: 61st of 77 54 spots7th of 77

Total Childcare Capacity: 2015-2023

Chart
Line chart with 9 data points.
The chart has 1 X axis displaying categories.
The chart has 1 Y axis displaying values. Data ranges from 259 to 651.
20152023
Value: 463 slots 66 slots529 slots
Rank: 31st of 77 5 spots26th of 77

Capacity By Provider Type: 2015-2023

Chart
Chart with 3 data series.
The chart has 1 X axis displaying categories.
The chart has 1 Y axis displaying values. Data ranges from 100 to 651.
 Child Care Center 60 slots Family Child Care Home 92 slots License-Exempt Child Care Center 98 slots

ExceleRate Accredited Child Care Centers: 2016-2023

Chart
Chart with 4 data series.
The chart has 1 X axis displaying categories.
The chart has 1 Y axis displaying values. Data ranges from 1 to 1.
 Circle of Quality No change Bronze Rating No change Silver Rating No change Gold Rating No change

ExceleRate Accredited Family Child Care Homes: 2016-2023

Chart
Chart with 4 data series.
The chart has 1 X axis displaying categories.
The chart has 1 Y axis displaying values. Data ranges from 0 to 16.
 Circle of Quality No change Bronze Rating No change Silver Rating No change Gold Rating No change

Academic Performance

Third Graders Proficient in Math: 2015-2024

Chart
Line chart with 9 data points.
The chart has 1 X axis displaying categories.
The chart has 1 Y axis displaying values. Data ranges from 1.47 to 24.32.
20152024
Value: 22.56% 7.4%15.16%
Rank: 53rd of 77 10 spots63rd of 77

Sixth Graders Proficient in Math: 2015-2024

Chart
Line chart with 9 data points.
The chart has 1 X axis displaying categories.
The chart has 1 Y axis displaying values. Data ranges from 0.44 to 12.08.
20152024
Value: 7.3% 1.57%5.73%
Rank: 5th of 77 9 spots14th of 77

Third Graders Proficient in ELA: 2015-2024

Chart
Line chart with 9 data points.
The chart has 1 X axis displaying categories.
The chart has 1 Y axis displaying values. Data ranges from 1.61 to 26.73.
20152024
Value: 24.9% 11.97%12.93%
Rank: 52nd of 77 20 spots72nd of 77

Sixth Graders Proficient in ELA: 2015-2024

Chart
Line chart with 9 data points.
The chart has 1 X axis displaying categories.
The chart has 1 Y axis displaying values. Data ranges from 3.23 to 22.72.
20152024
Value: 14.03% 8.69%22.72%
Rank: 63rd of 77 2 spots65th of 77

Attendance: SY2122-SY2425

Chart
Line chart with 4 data points.
The chart has 1 X axis displaying categories.
The chart has 1 Y axis displaying values. Data ranges from 86.665 to 87.715.
SY2122SY2425
Value: 86.89% 0.83%87.72%
Rank: 53rd of 77 16 spots37th of 77

Freshmen On Track: SY2122-SY2425

Chart
Line chart with 4 data points.
The chart has 1 X axis displaying categories.
The chart has 1 Y axis displaying values. Data ranges from 77.01 to 88.19.
SY2122SY2425
Value: 77.01% 11.18%88.19%
Rank: 56th of 77 21 spots35th of 77

Graduation Rate: SY2122-SY2425

Chart
Line chart with 4 data points.
The chart has 1 X axis displaying categories.
The chart has 1 Y axis displaying values. Data ranges from 63.805 to 72.82.
SY2122SY2425
Value: 63.8% 9.01%72.82%
Rank: 69th of 77 4 spots65th of 77

School Climate

Mobility Rate: SY2122-SY2425

Chart
Line chart with 4 data points.
The chart has 1 X axis displaying categories.
The chart has 1 Y axis displaying values. Data ranges from 9.18 to 19.81.
SY2122SY2425
Value: 9.18% 10.63%19.81%
Rank: 4th of 77 34 spots38th of 77

Suspensions: SY2122-SY2425

Chart
Line chart with 4 data points.
The chart has 1 X axis displaying categories.
The chart has 1 Y axis displaying values. Data ranges from 4.18 to 13.684999999999999.
SY2122SY2425
Value: 4.18% 9.5%13.68%
Rank: 13th of 77 54 spots67th of 77

Student Outcomes

College Enrollment: SY2122-SY2425

Chart
Line chart with 4 data points.
The chart has 1 X axis displaying categories.
The chart has 1 Y axis displaying values. Data ranges from 31.53 to 62.715.
SY2122SY2425
Value: 62.72% 31.19%31.53%
Rank: 38th of 77 38 spots76th of 77

College Persistence: SY2122-SY2425

Chart
Line chart with 4 data points.
The chart has 1 X axis displaying categories.
The chart has 1 Y axis displaying values. Data ranges from 37.980000000000004 to 39.465.
SY2122SY2425
Value: 39.47% 0.42%39.04%
Rank: 77th of 77 2 spots75th of 77

ISBE 5Essentials Survey

Student Response Rate: SY2122-SY2425

Chart
Line chart with 4 data points.
The chart has 1 X axis displaying categories.
The chart has 1 Y axis displaying values. Data ranges from 62.68 to 92.11.
SY2122SY2425
Value: 62.68% 29.43%92.11%
Rank: 35th of 77 29 spots6th of 77

Teacher Response Rate: SY2122-SY2425

Chart
Line chart with 4 data points.
The chart has 1 X axis displaying categories.
The chart has 1 Y axis displaying values. Data ranges from 67.55 to 73.19.
SY2122SY2425
Value: 73.19% 3.83%69.36%
Rank: 27th of 77 30 spots57th of 77

5Essentials: Involved Families: SY2122-SY2425

Chart
Chart with 6 data series.
The chart has 1 X axis displaying categories.
The chart has 1 Y axis displaying values. Data ranges from 0 to 13.
 Very Weak No change Weak 4 schools Neutral 3 schools Strong 2 schools Very Strong No change Not Enough Data No change

5Essentials: Effective Leadership: SY2122-SY2425

Chart
Chart with 6 data series.
The chart has 1 X axis displaying categories.
The chart has 1 Y axis displaying values. Data ranges from 0 to 13.
 Very Weak No change Weak 2 schools Neutral 1 schools Strong 2 schools Very Strong No change Not Enough Data No change

5Essentials: Supportive Environment: SY2122-SY2425

Chart
Chart with 6 data series.
The chart has 1 X axis displaying categories.
The chart has 1 Y axis displaying values. Data ranges from 0 to 13.
 Very Weak No change Weak 3 schools Neutral No change Strong 3 schools Very Strong No change Not Enough Data No change

5Essentials: Safety: SY2122-SY2425

Chart
Chart with 6 data series.
The chart has 1 X axis displaying categories.
The chart has 1 Y axis displaying values. Data ranges from 0 to 13.
End of interactive chart.
 Very Weak 6 schools Weak 5 schools Neutral 1 schools Strong No change Very Strong 1 schools Not Enough Data 13 schools

5Essentials: Collaborative Teachers: SY2122-SY2425

Chart
Chart with 6 data series.
The chart has 1 X axis displaying categories.
The chart has 1 Y axis displaying values. Data ranges from 0 to 13.
End of interactive chart.
 Very Weak 1 schools Weak No change Neutral 1 schools Strong 1 schools Very Strong No change Not Enough Data No change